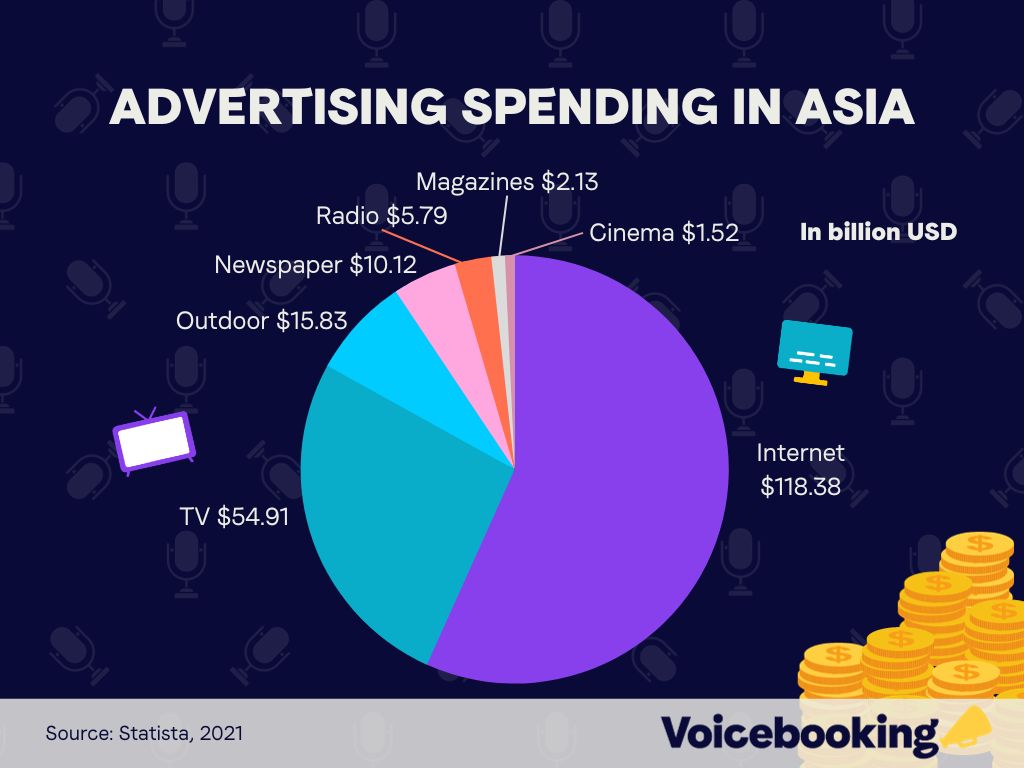
- Internet (61.9%)
- TV (22.72%)
- Outdoor (5.17%)
- Radio (3.84%)
- Newspaper (3.71%)
- Magazines (2.17%)
- Cinema (0.3%)
We’ve compiled a worldwide collection of statistics about advertising spend and revenue, with numbers from 2021, 2022 and projected numbers for the end of 2023 to 2027. All data has been collected from reputable sources.
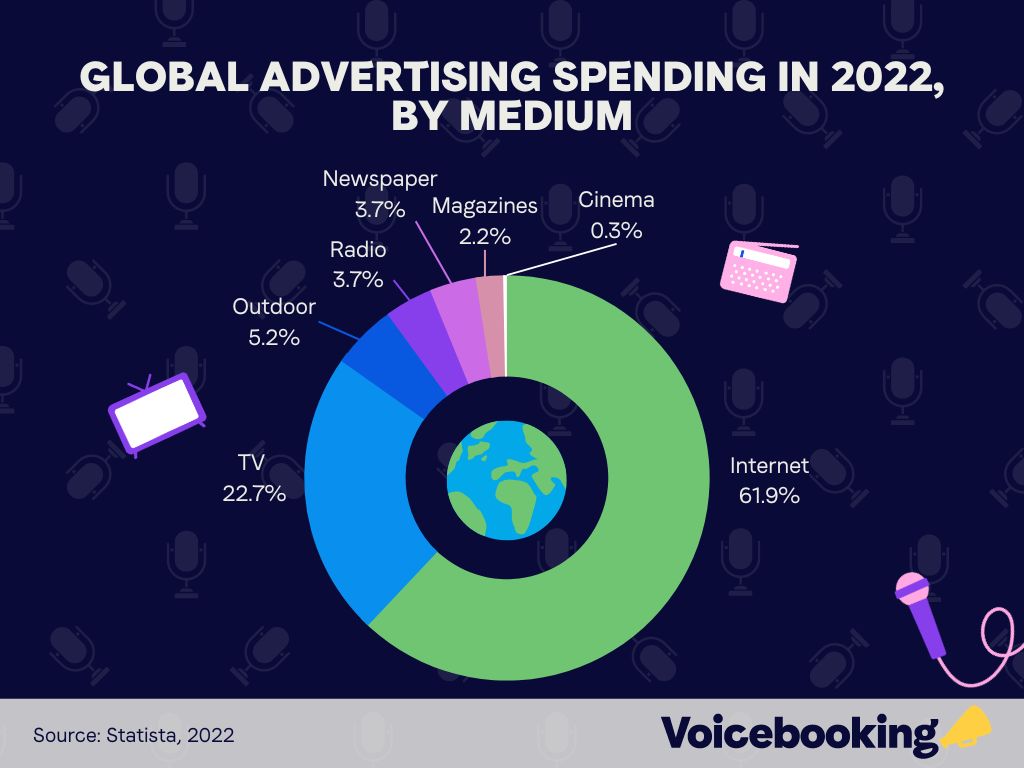
In 2022, digital ads made up the bulk of overall ad spend allocation covering over 60% of total budget. This is also projected to grow to 72.5% by the end of 2026.
Between 2014 to 2022, radio ad spend dropped from 6.9% to 5%.
Global social media ad spend is calculated to grow, with a projected spend of $233.65 billion by 2027, up significantly from the reported $130.24 billion recorded at the end of 2022.
As a whole, digital ad spending is globally projected to reach $835 billion by the year of 2026.
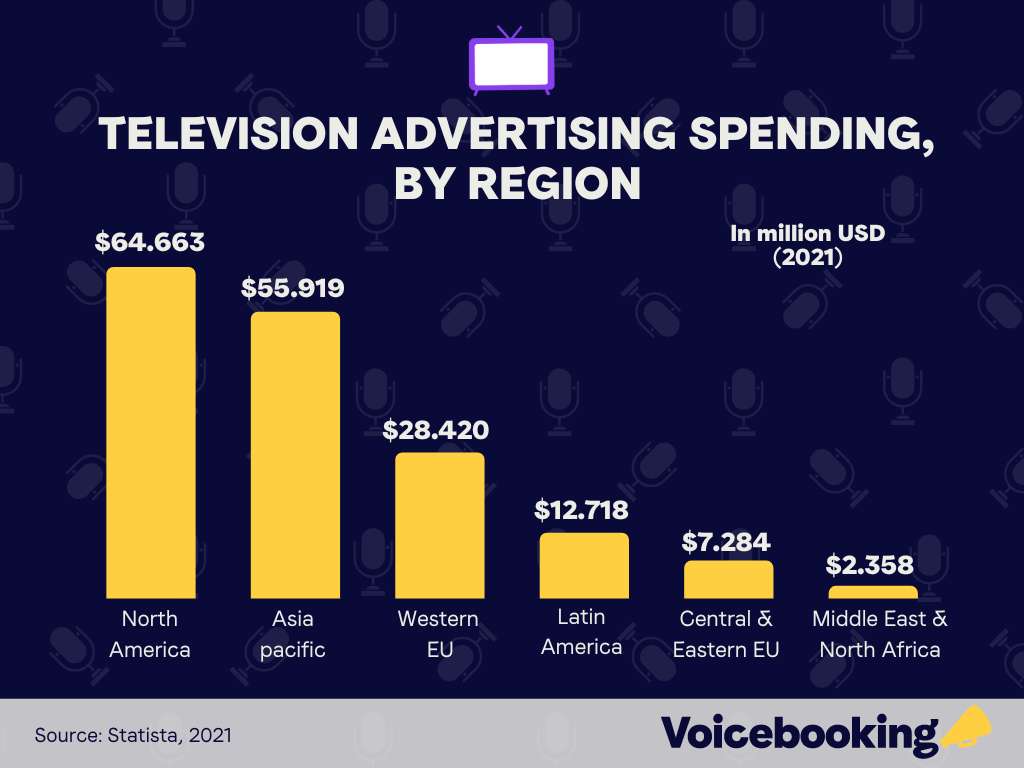
The amount allocated towards Television ad spend varies highly depending on the region in question, 2021 numbers summarised below:
Mediums in which ad revenue is projected to grow include: TV and Video advertising, the audio ad niche, outdoor advertising & cinema.
Newspaper and magazine commercial revenue is projected to decline by 2027, following the growth in overall digitisation lowering the demand for offline mediums of advertising.
TV ad revenue is projected to grow, with 2022 numbers showing a total $171 billion on a global scale. Forecasts project TV ad revenue growing from $169 billion to $185 billion, over the period of 2023 to 2026.
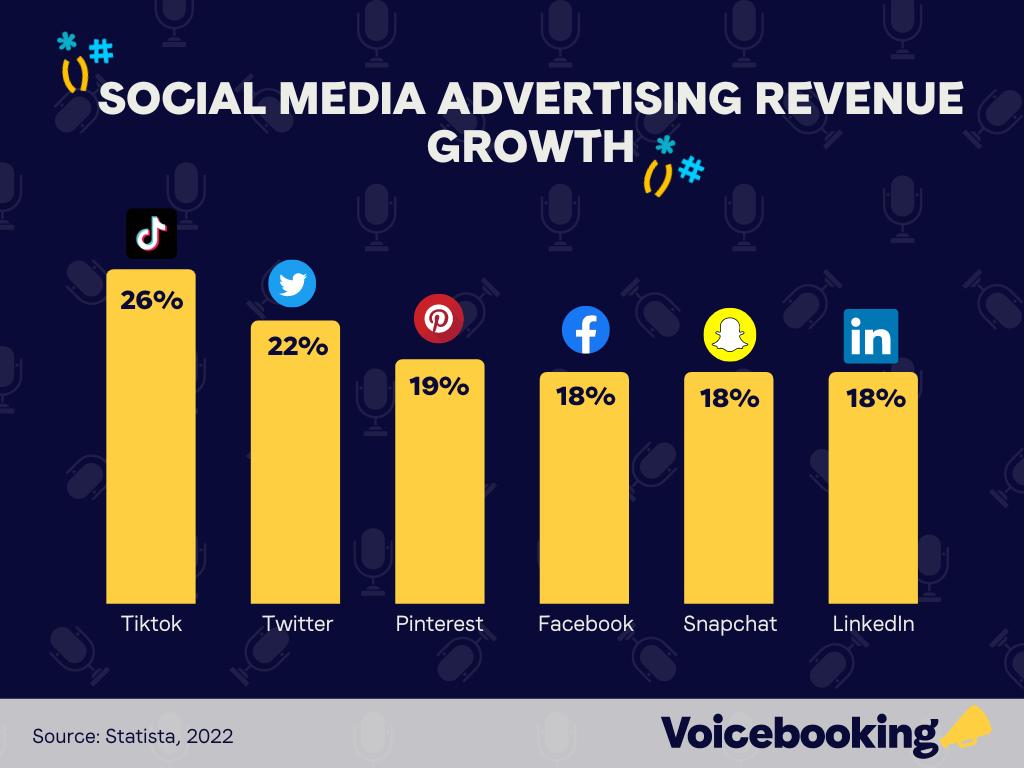
Social media ad revenue in 2022 has seen exponential growth, considering the rise in popularity of the ad medium; with the following growth across their respective platforms:
Digital advertising spend in Europe surpassed $96.9 billion at the end of 2022, up 5% year on year, from $92 billion in 2021.
Overall social media ad spend in Europe has been on a steady rise, growing 40% in 2021, and a further 25.5% following the end of 2022.
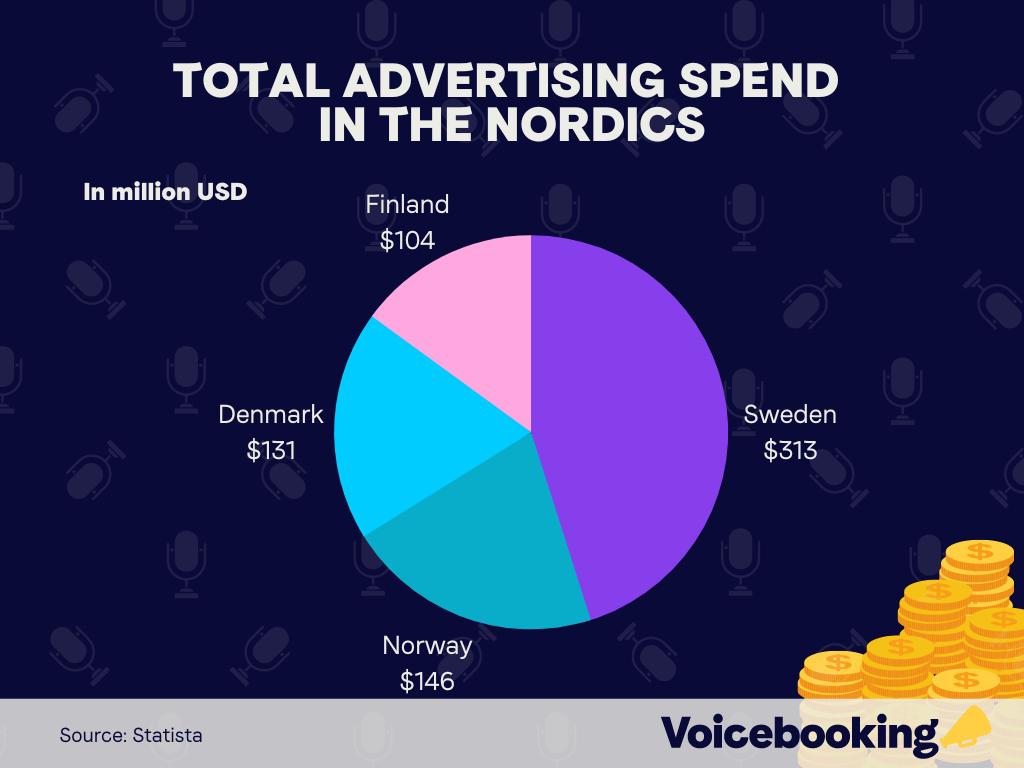
Total ad spend for the following Nordic countries was:
The largest digital ad market in the Nordic region of Europe is Sweden, by far.
In 2022, the nation spent $646.81 million SEK on radio ads, up by 3.13% compared to the previous year.
Online ad spend was among the highest allocated budgets, with $6.01 billion SEK spent there, a rise of +2.4% year on year. Within that, podcast ad spending was $282 million SEK in 2021.
Cinema ad budget was among the mediums that most significantly changed year on year. Rising from $48.8 million SEK to $110.8 million SEK, a large rise of +127%.
Between 2020 and 2025, Sweden’s filmed entertainment revenue growth was projected to grow 63.8%. Cinema ad revenue was projected to be $261.15 million by 2023.
TV ad revenue for Sweden reached $4.8 billion SEK, a -1.6% decrease year on year compared to 2021.
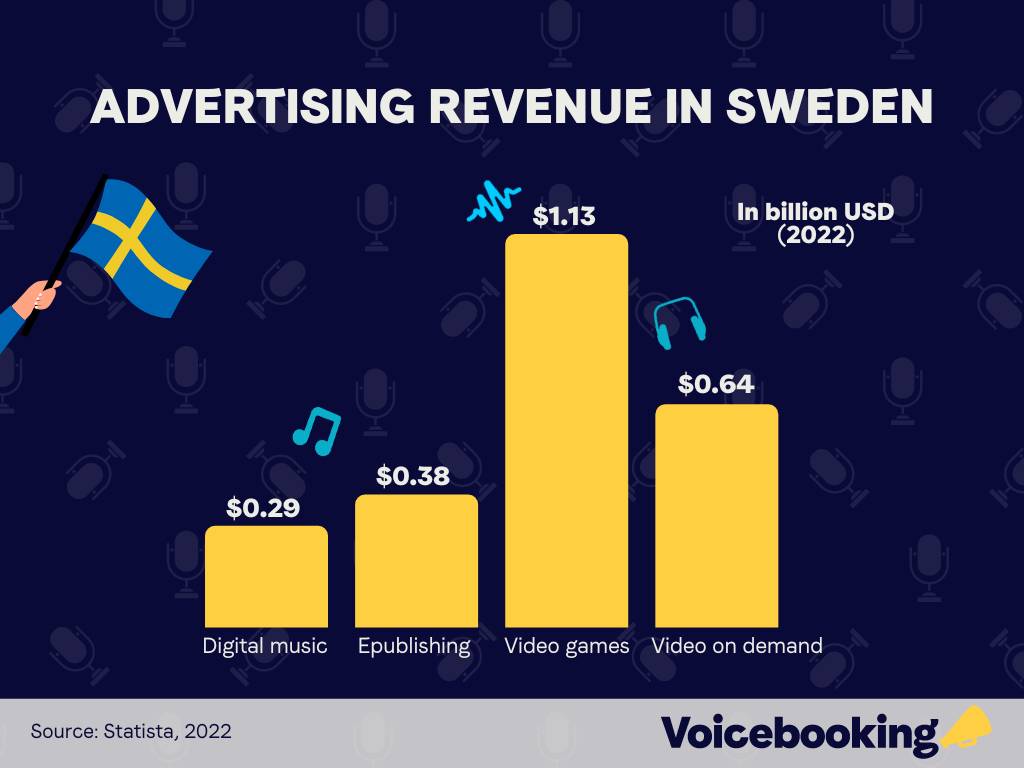
Ad revenue in Sweden 2022, from digital media can be broken down like so:
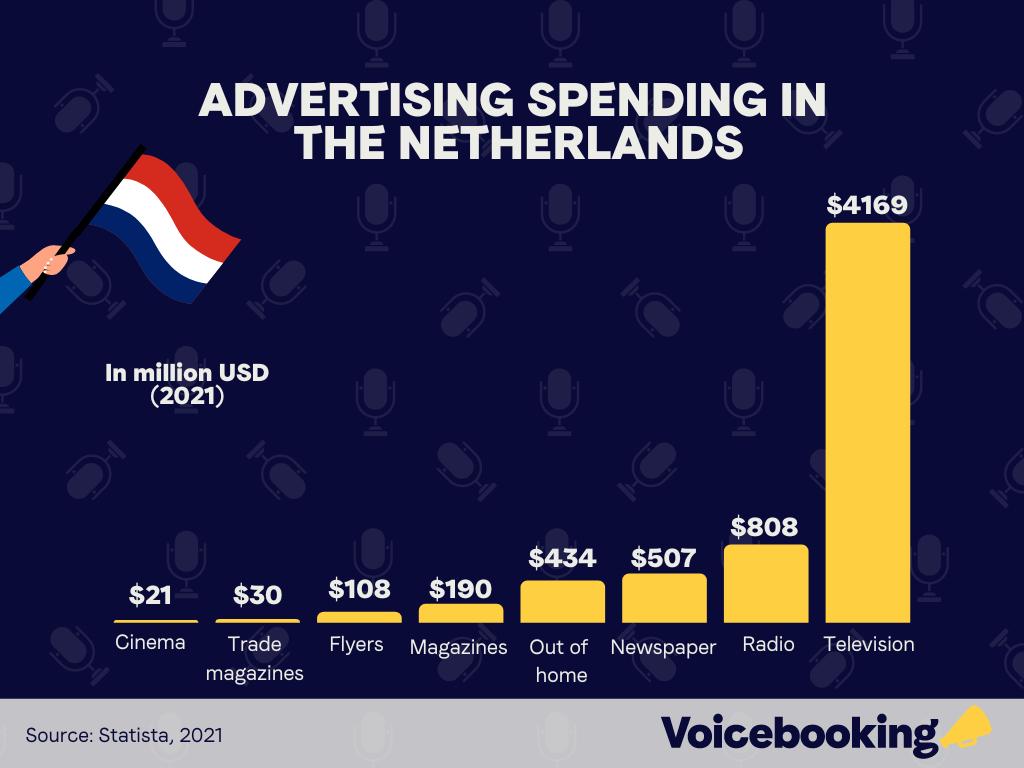
In 2021, Dutch ad spend can be summarised like so:
In 2022 the Netherlands spent a total of $1.24 billion on social ad spend, projected to reach $1.52 billion by the end of 2026 (growth of +22.6%).
Overall ad revenue in the Netherlands is projected to reach €7.1 billion by 2026.
It is predicted that by 2027, 82.3% of digital advertising revenue will come from programmatic advertising.
Revenue generated from radio advertising amounted to €220-€230 million in 2022.
Dutch cinema ad revenue reached $11.04 million in 2022. Overall mobile revenue share of digital advertising was 46.31% projected to reach 51.61% in 2027.
In Q1 of 2023, revenue for the advertising and market research sector is projected to grow 37.4% compared to Q4 2022.
Overall ad spend in Germany is projected to reach $28.47 billion by the end of 2023.
Share of digital advertising spending hit 12.1% in 2022, down by -0.1% YOY.
Social media ad spending was €3.01 billion and €0.7 billion for mobile and desktop, respectively, projected to hit €5.5 billion and €1.14 billion by 2027.
Desktop advertising spending reached €2.77 billion in 2022, down from €2.99 billion from the previous year. Mobile advertising in 2022 reached €1.72 billion, up from €1.69 billion.
Programmatic ad spending in Germany reached $12.22 billion in 2022, up from $10.51 billion in 2021 (numbers only available in USD).
Share of digital advertising spending in 2022 was 62% desktop and 38% for mobile; mobile share rose 2% whilst desktop share fell -2%.
Outdoor ad revenue in Germany reached €1301 million in 2022, projected to reach €1428 million by 2026.
German audio advertising revenue is projected to reach €832 million and €134 million, for radio and podcasts, respectively. By 2025, it’s projected that radio will reach €838 million, and podcast will reach €165 million.
Online commercial advertising revenue in Germany is projected to reach €14.53 billion by the end of 2023.
TV and streaming revenue in 2022 reached €4.38 billion and €1.35 billion within TV and in-stream video advertising, respectively. TV ad revenue is projected to reach €4.64 million by the end of 2023.
It is projected that by 2025 Germany’s advertising industry revenue will reach a total €36.1 billion.
In 2021, Belgian offline ad spend reached €3.87 billion.
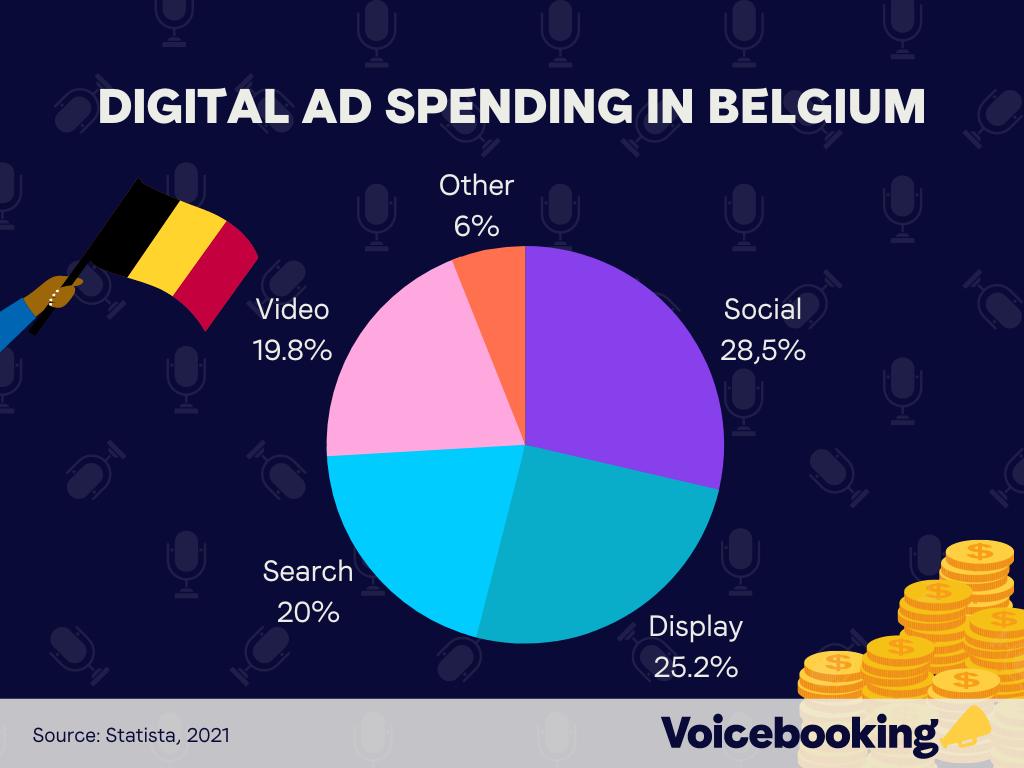
Digital ad spending in 2021 reached €902 million, which was 34.3% of the total share of ad spend in Belgium.
Broken down by format:
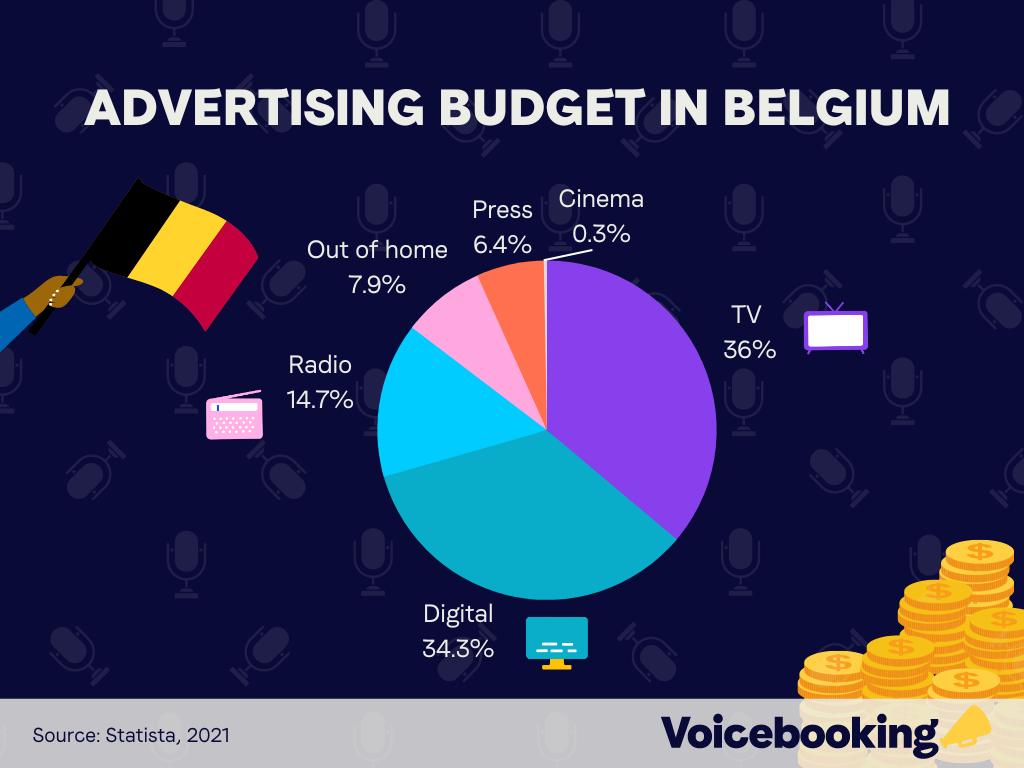
Broken down further, here is how the overall Belgian ad budget was allocated in 2021:
In 2021, Belgian ad revenue reached $4.2 billion, and is projected to reach 3.76 billion by 2026.
In 2022, Belgian ad revenue reached approximately €6.39 billion.
As of 2022, France spent $8.95 billion on traditional advertising methods, and $10.61 billion on digital media.
Digital video, as a proportion of the ad spend, reached $893.92 million within the same year, up from $765.90 million, a +16.7% increase year on year.
Share of TV and professional video advertising spending in 2022 made up 15.4% of the total budget, and is projected to decrease to 12.7% by 2027.
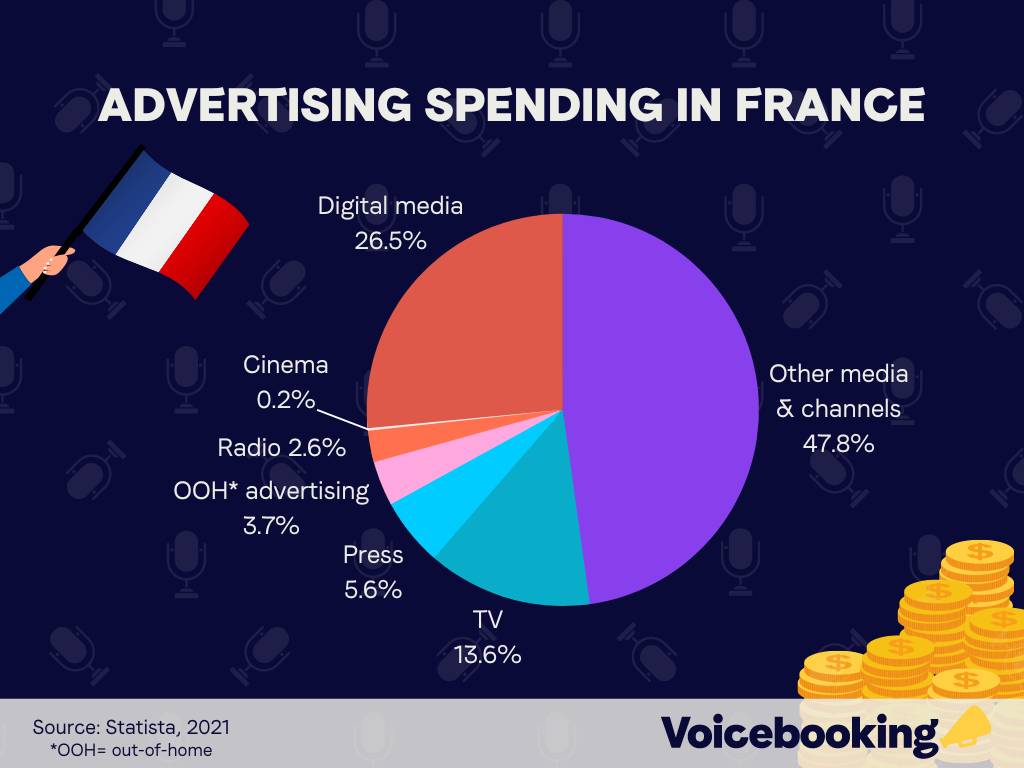
In 2021, ad spending could be broken down by the following means:
Overall, ad spending in France was distributed by: linear means (37.8%) and digital means (62.2%).
Ad revenue return from TV advertising amounted to €3.4 billion in 2022, down from €3.6 billion in 2021.
In 2022, 92% of total budget was allocated to traditional TV, and 8% was broadcast video on demand; projected to be 83% and 17%, for traditional TV and BVOD, respectively.
Social media ad spending amounted to €2.23 billion euros in 2022, whilst podcast ad spending only amounted to €6 million.
Out-of-home ad revenue in France reached €228 million in 2022.
Radio ad revenue amounted to €699 million, and cinema ad revenue reached €64 million in 2022.
In 2022, Switzerland spent $5.56 billion on advertising, projected to reach $6.62 billion by 2027.
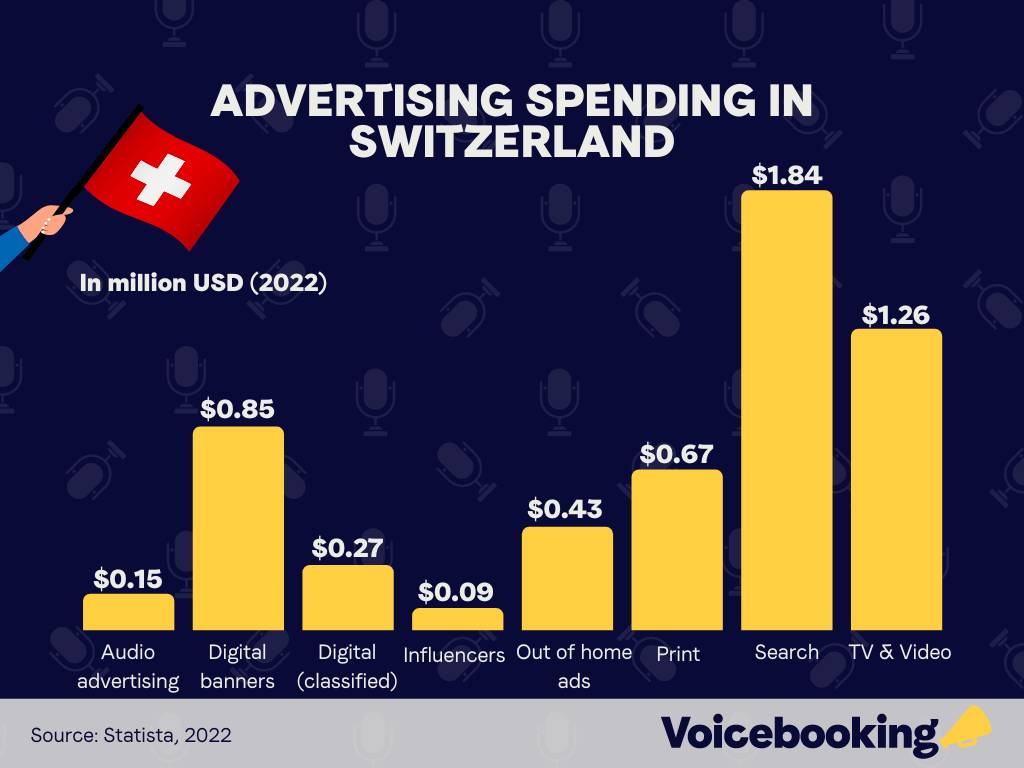
In 2022, ad spending in Switzerland by segment can be summarised like so:
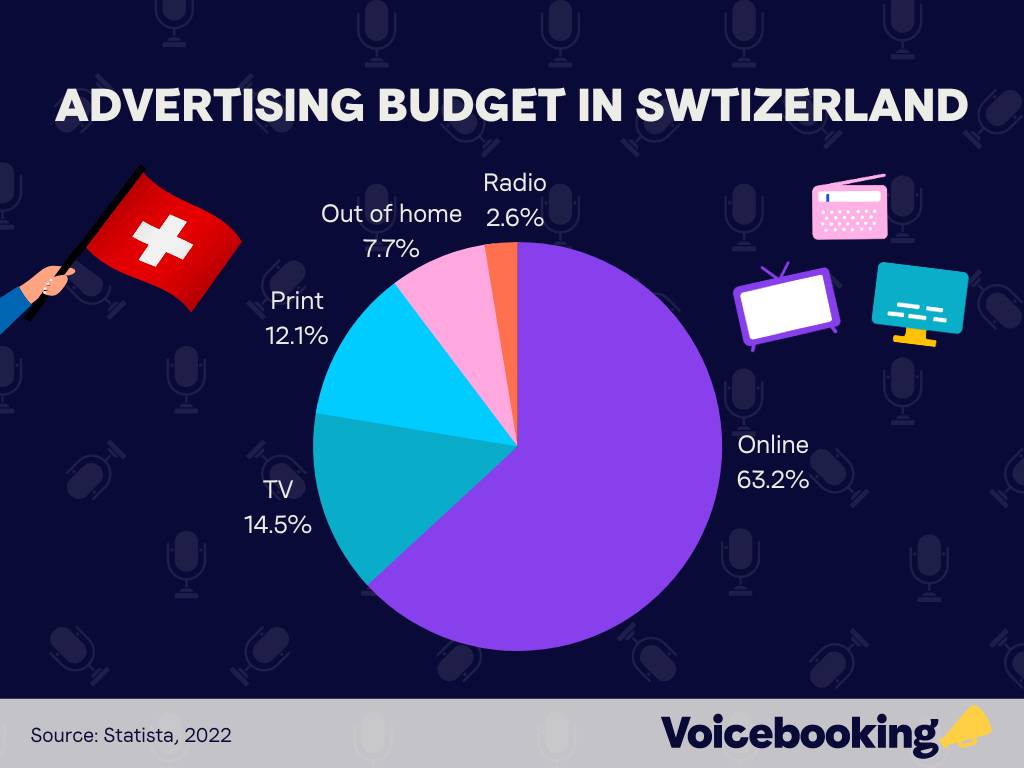
From an overarching perspective, split up by media, ad budget percentage in 2022 was allocated like so:
In 2022 digital ads made up 64.7% and traditional media made up 35.3%; by 2027 this is projected to reach 74.1% and 25.9% for the same mediums, respectively.
Of which, social media ad spend made up $0.46 billion of 2022’s budget, projected to increase to $0.56 billion by 2027.
Ad industry revenue in Switzerland was $2718.77 million in 2022, projected to drop to $2654.01 million by 2025.
Total ad spending in Western Europe totalled $130.2 billion in 2021, projected to reach $153.08 billion by the end of 2024.
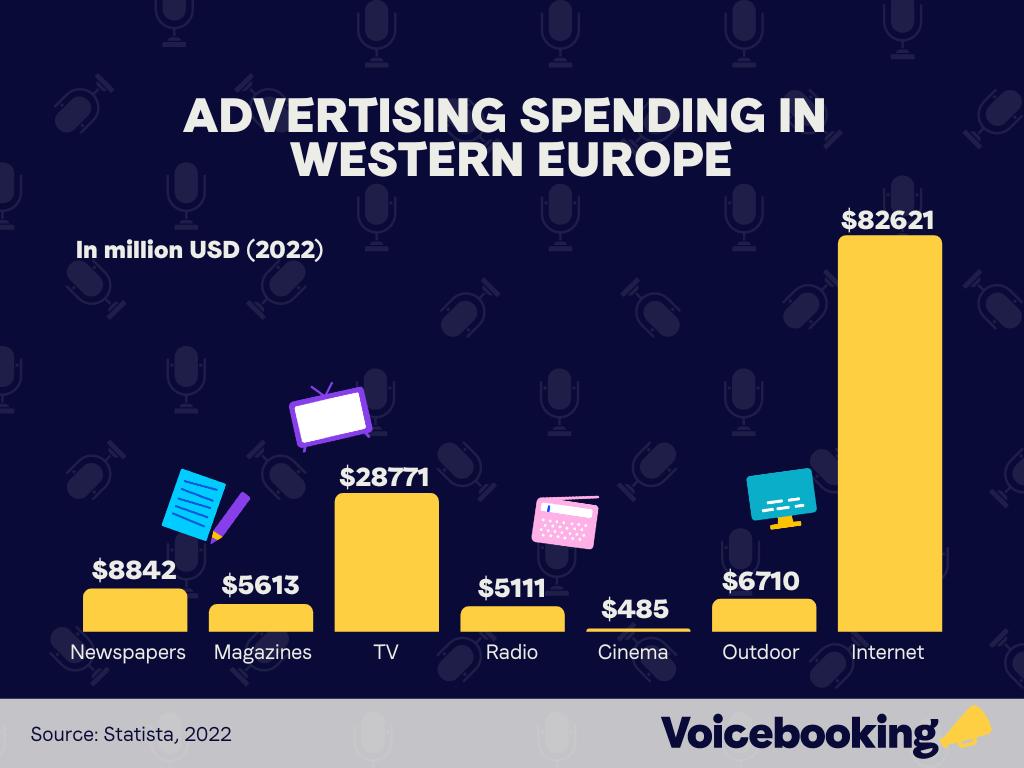
In 2022, overall ad spending increased to $138.15 billion, broken down by the following mediums:
Radio ad spending in Western Europe hit $5111 million in 2022, projected to reach $5238 million by the end of 2023.
TV ad spending reached $28771 million in 2022, projected to reach $29009 by 2023’s year end.
Magazine and newspaper ad spend is projected to decrease by 2024, by -6.3% and -7.4%, respectively.
Cinema advertising spend was among the lowest in terms of allocated budget, along with radio, magazines and newspapers. However, the cinema advertising budget was projected to grow by 2024, from $485 million to $569 million (a +17.3% increase).
In 2022, the UK spent $30.91 billion on advertising, up 6% year on year, and is projected to reach $32.45 billion by the end of 2023.
In 2021, $127.63 million was spent on cinema advertising costs. Regarding tv ad spend, a total of $6751 million was allocated towards that medium.
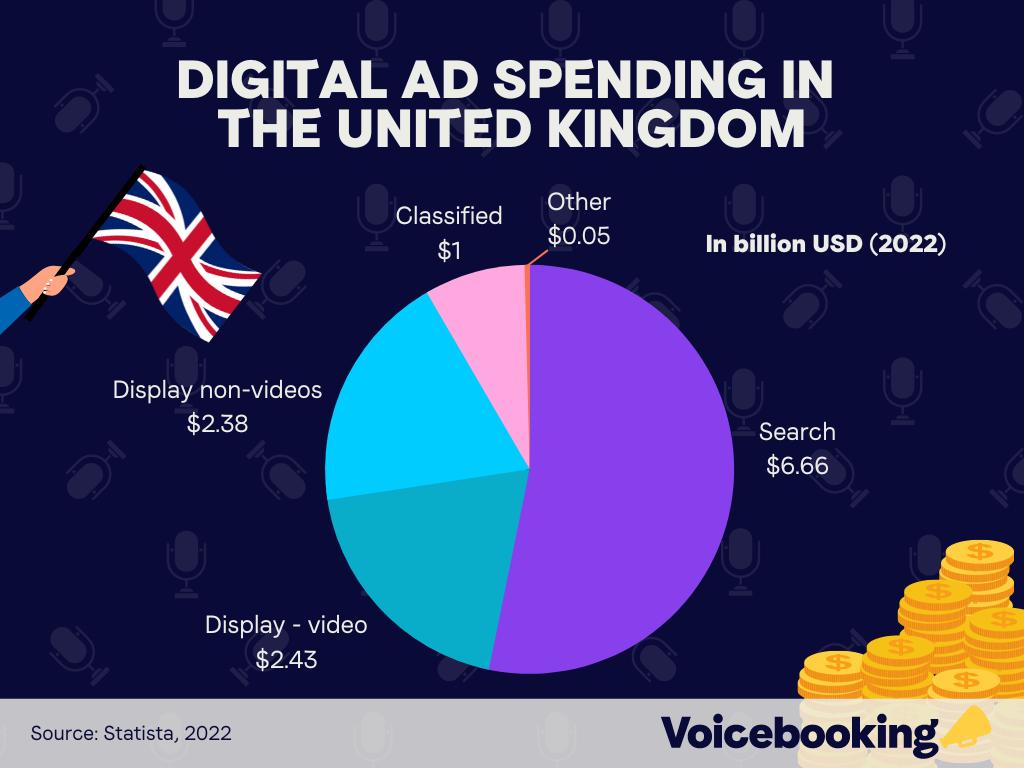
Digital advertising spend in 2022 can be broken down like so:
Areas where ad spend is projected to grow the most by 2023 include:
Cinema as a medium of advertising is projected to grow at the highest rate, at 31% comparing 2022 to 2023.
Areas where ad spend is projected to decline in 2023 include:
The majority of ad mediums projected to lower spend by 2023 consist of direct mail and majority offline magazine and newspaper modes, with the highest drop being from regional newsbrands.
UK ad revenue in 2022 reached $48.39 billion.
Of which, radio advertising contributed $918.21 million. Cinema ad revenue reached $222.82 million, forecasted to reach $225.8 million, a rise of 1.3%.
Overall ad spend in Africa is projected to reach $5.1 billion by the end of 2023. Of this total budget, TV ad spend in 2022 hit $1.73 billion, projected to reach $1.86 billion by 2027.
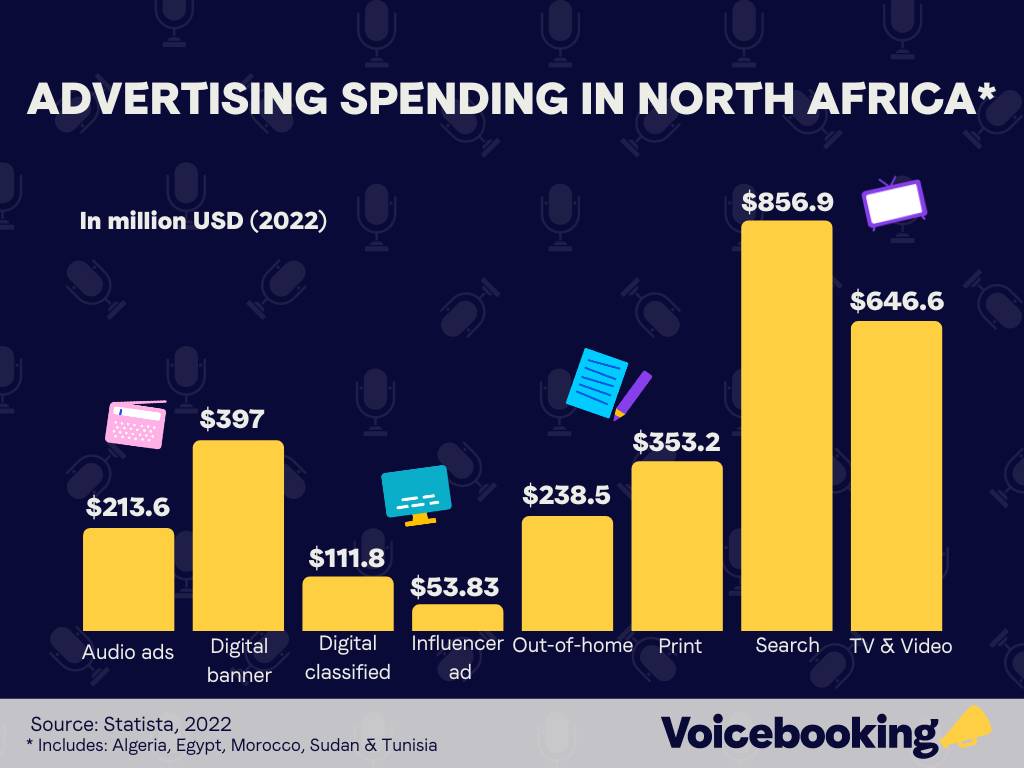
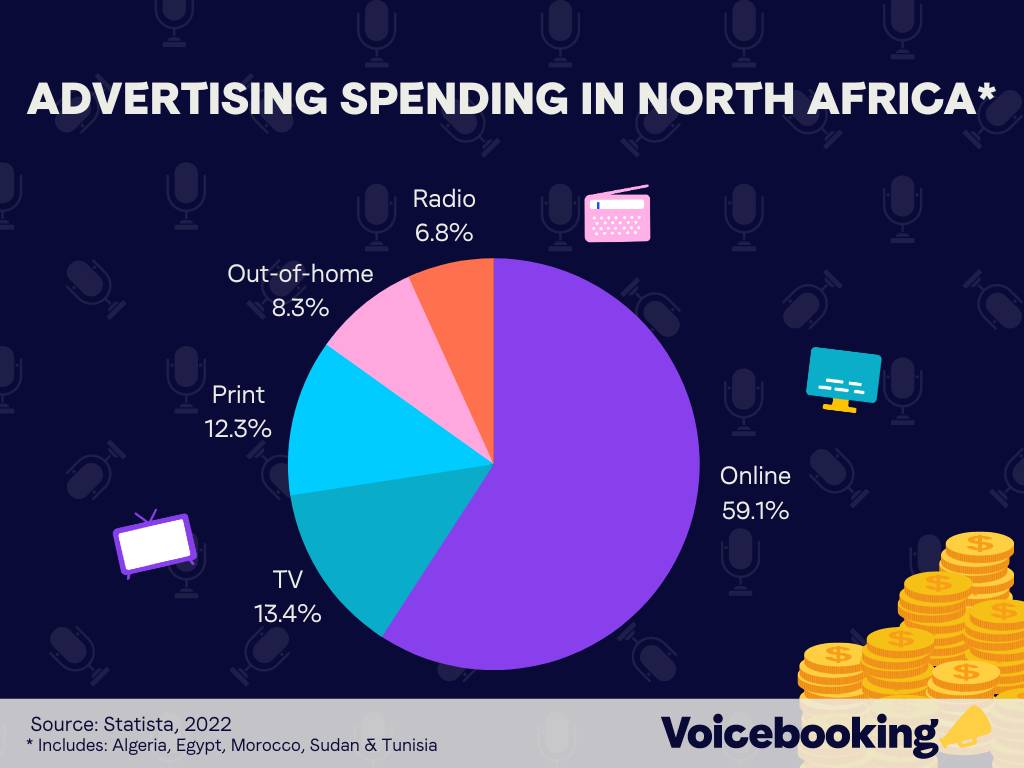
North African 2022 ad spend statistics, compiled from Algeria, Egypt, Morocco, Sudan & Tunisia, can be broken down, by medium, like so:
Ad spending share in 2022 was made up of 61.2% digital and 31.8% traditional modes, projected to reach 69% and 31% by 2027, respectively.
Social media spend reached $369.4 million in 2022, projected to reach $485.7 million by 2027.
In 2022, ad spending by media can be broken down like so:
Total ad spend for Ghana reached $245 million as of 2021, 19.4% was made up of digital ad spend, and 80.6% traditional advertising, projected to reach 27% and 73% in 2027, for digital and traditional mediums, respectively.
TV ad spend accounted for $39 million, whilst digital ad spend accounted for $25 million.
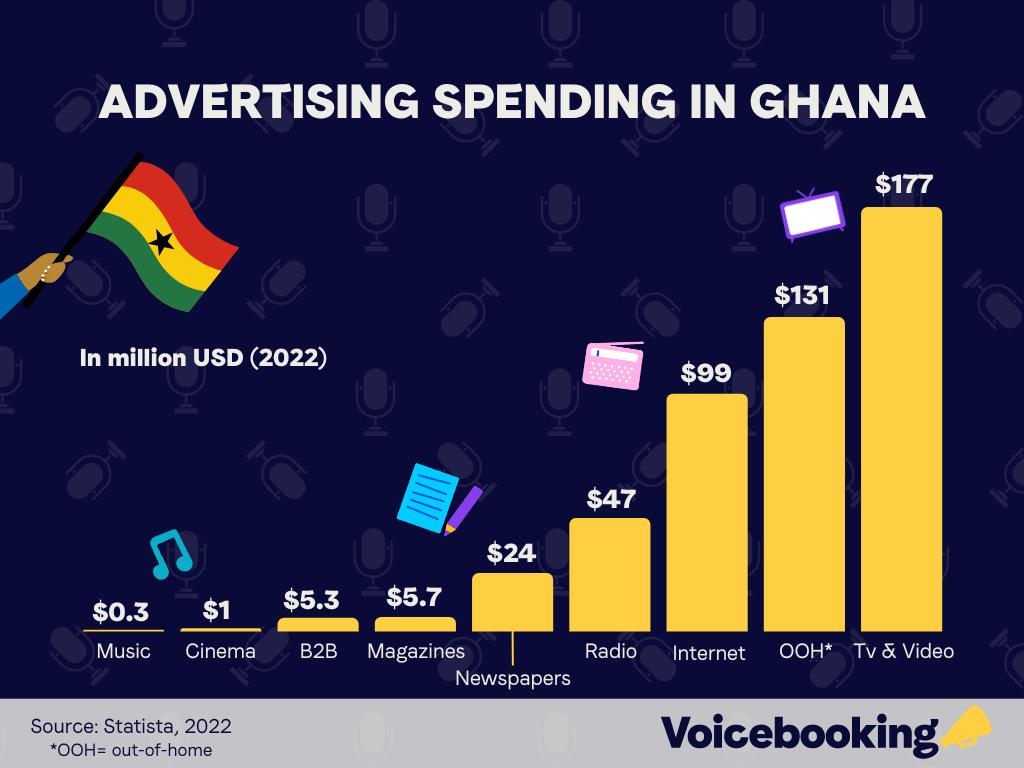
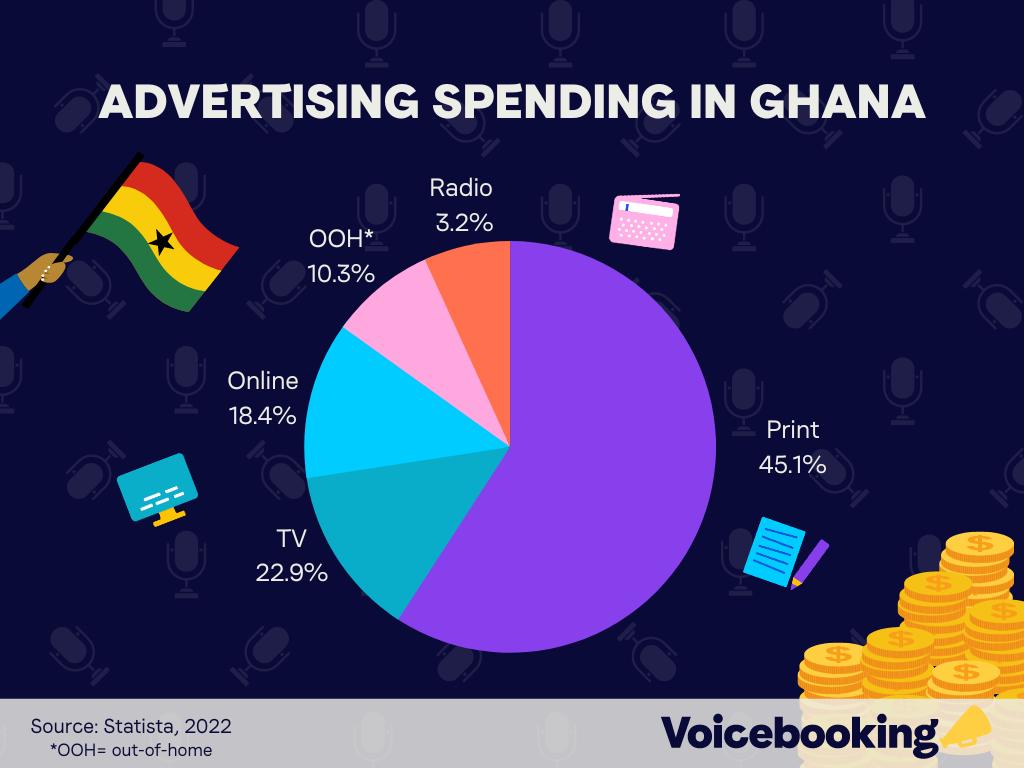
In 2022, total ad spend, by medium, can be broken down into the following percentages:
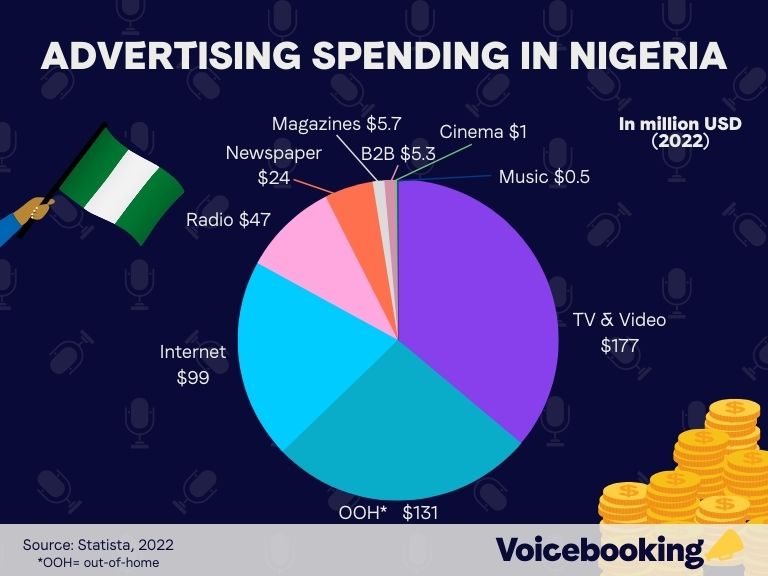
Total ad spend for Nigeria reached $490 million at the end of 2020.
Of which, TV ad spend made up $276 million, and digital media ad spend made up $111 million.
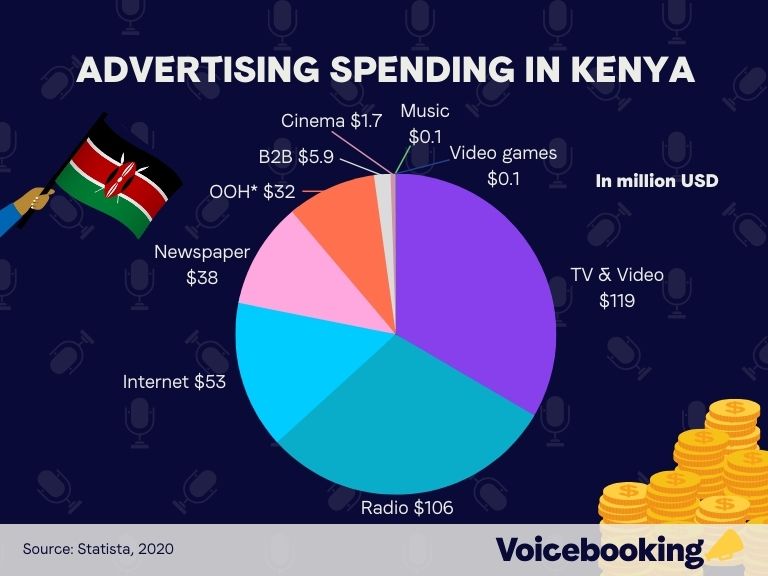
Total ad spend reached $367.8 million in the year of 2020, with TV ad spend making up $137 million, and digital ad spending making up $59 million.
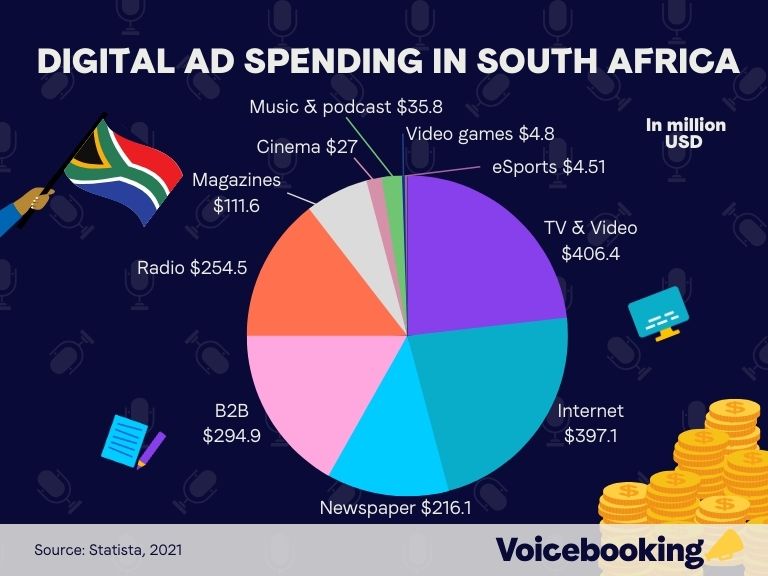
Total ad spend reached $1.78 billion in 2021, digital ad spend reached $597 million whilst TV ad spend surpassed $436 million.
Of the MENA region (Middle East & North Africa) radio ad spend reached $226 million in 2022, projected to reach $232 million by 2024.
In 2021, the percentage of year on year MENA ad spend growth and decline (by medium) can be summarised below:
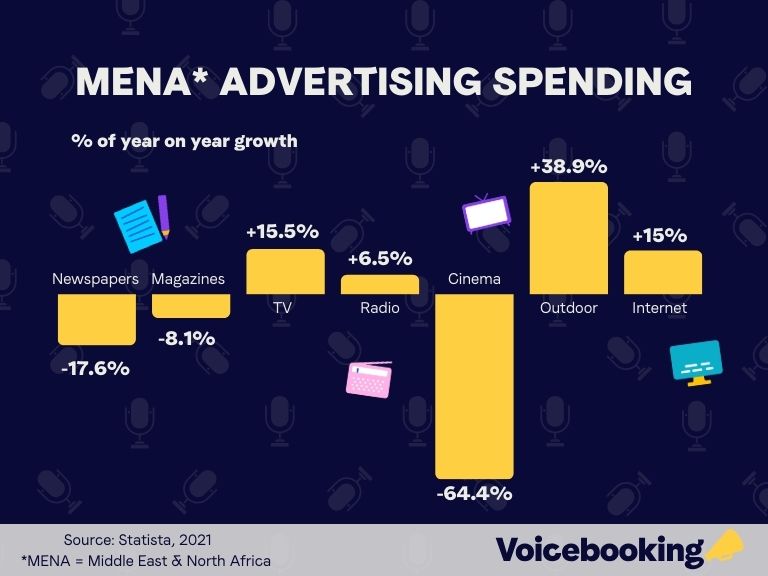
The biggest drops in ad budget came from newspaper, magazine and cinema advertising spend, whilst there was a significant rise in television, internet & outdoor ad spending.
In 2018, the Middle East & Africa region generated a total $10.6 billion in TV ad revenue.
The majority of 2022 ad spend in Saudi Arabia goes towards digital advertising mediums, broken down by the following:
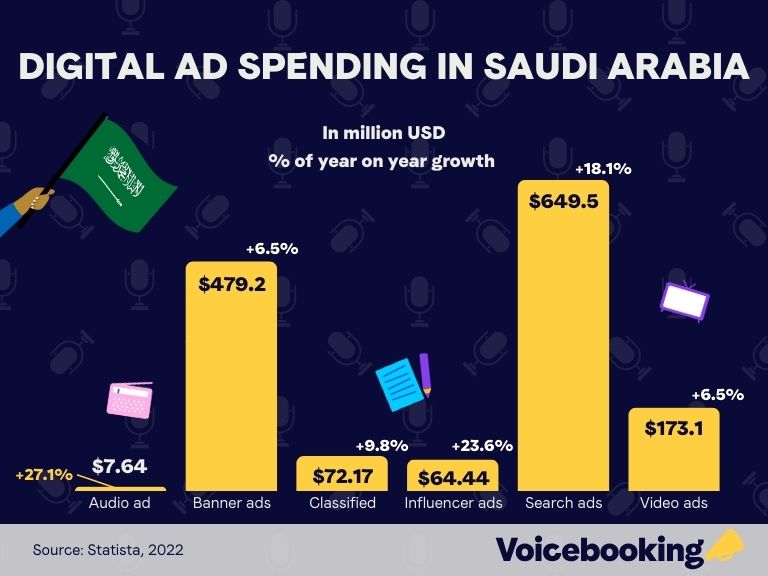
Ad spending share allocated 51.3% to desktop and 48.7% to mobile devices, respectively. In 2022, ad spending dedicated to social media reached $369.9 million, projected to reach $500.3 million by 2027.
Overall ad revenue in 2022 reached $1.45 billion, expected to grow to $2.33 billion by 2027.
The majority of 2022 ad spend in Iran goes towards digital advertising mediums, broken down by the following:
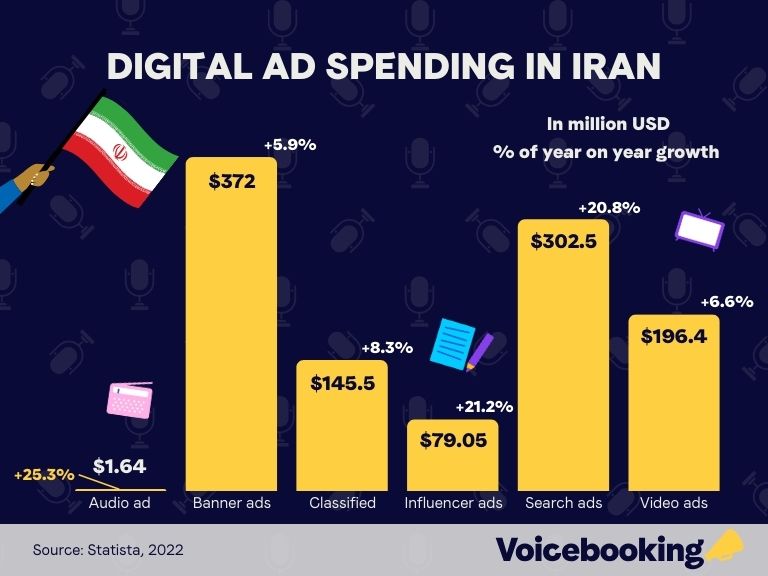
Ad spending share between mobile and desktop was split by 52.3% desktop and 47.7% mobile, projected to be 51.7% and 48.3% by 2027 for desktop and mobile, respectively.
In 2022, social media ad spending reached $371.4 million, projected to reach $460.8 million by 2027.
Digital ad revenue overall reached $1.1 billion in 2022, projected to reach $1.71 billion in 2027.
The majority of Tunisia’s 2022 ad budget was allocated to digital mediums, broken down like so:
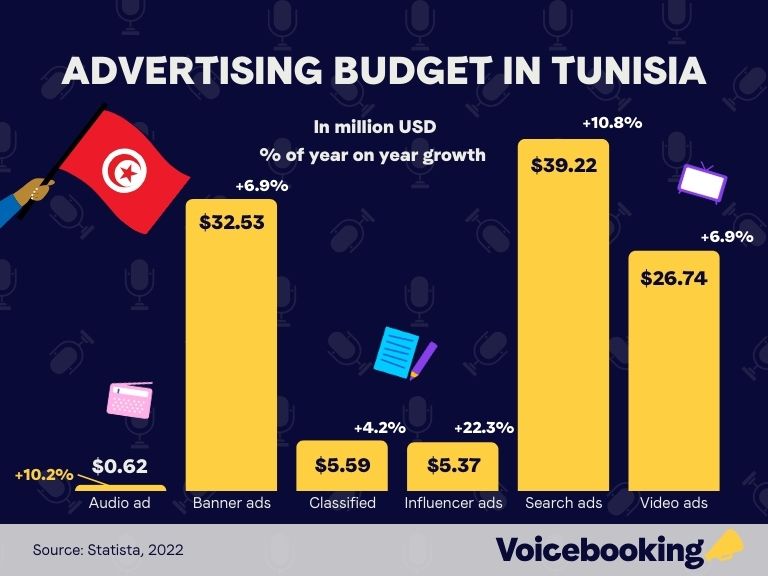
Share of ad spending in 2022 was made up of 52.3% desktop, and 47.7% mobile; projected to be 52.6% and 47.4% by 2027, for desktop and mobile, respectively.
In 2022, social media ad spending reached $36.52 million, projected to rise to $47.85 million by 2027.
Overall ad revenue for the region reached $0.11 billion in 2022, projected to reach $0.17 billion by 2027.
Qatar’s 2022 digital ad spending could be broken down like so:
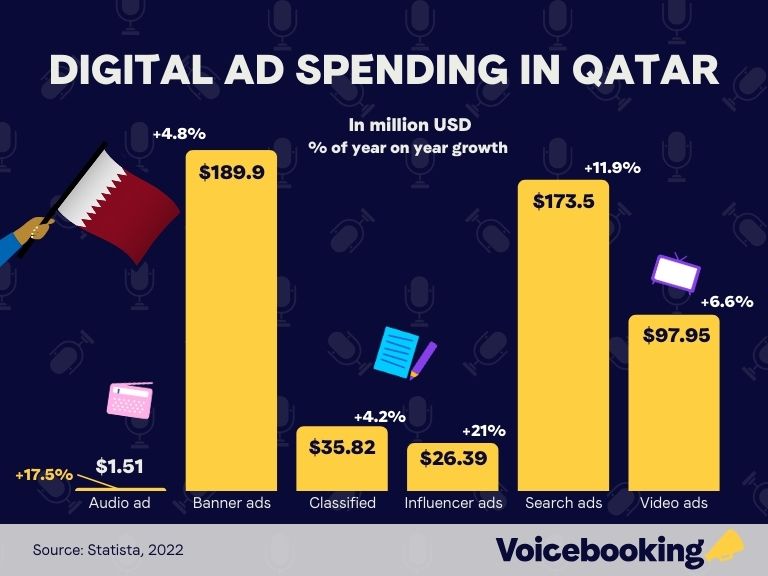
2022 digital ad spend was made up of 54.1% desktop and 45.9% mobile, projected to reach 54.2% and 45.8% for desktop & mobile, respectively.
2022 ad spending in social media reached $167.7 million, projected to reach $232.7 million by 2027.
Ad revenue in 2022 was $0.52 billion, projected to reach $0.77 billion by 2027.
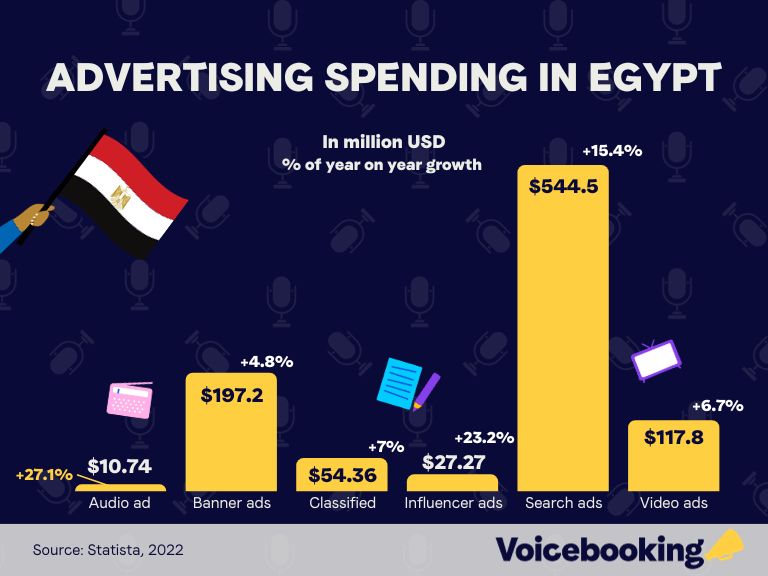
2022 ad spending can be broken down like so:
In 2022, ad spending share was broken down into 57.2% desktop and 42.8% mobile, by 2027 projected to reach 51.7% and 48.3%, for desktop and mobile, respectively.
Ad spending on social media in 2022 reached $51.12 million, projected to hit $66.76 million by 2027.
Ad revenue in 2022 reached $0.36 billion, projected to hit $0.59 billion by 2027.
In 2022, digital ad spend can be broken down into the following mediums:
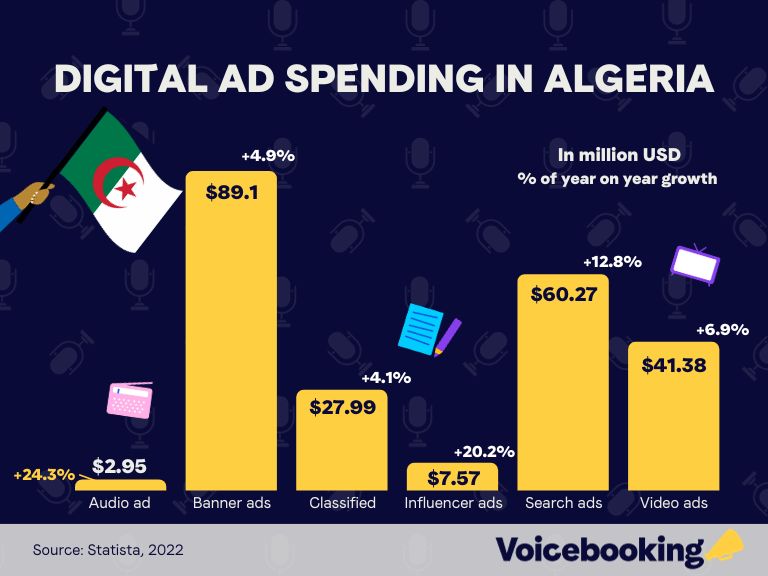
Ad spending was broken down into 56.1% desktop to 43.9% mobile, projected to reach 55.7% and 44.3% in 2027 for desktop and mobile, respectively.
Social ad spending reached $54.79 million in 2022, projected to reach $71.81 million in 2027.
Ad revenue in 2022 reached $0.23 billion, projected to reach $0.33 billion in 2027.
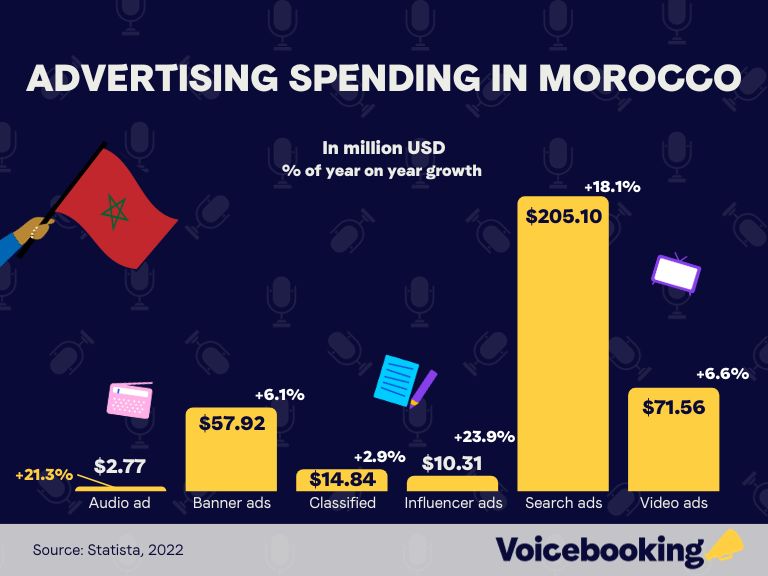
For 2022, ad spending can be summarised like so:
Ad spending share was broken down by 60.6% desktop and 39.4% for mobile, projected to reach 59.8% and 40.2% for desktop and mobile, respectively.
Social media ad spending in 2022 reached $209.5 million, projected to reach $276.5 million by 2027.
Ad revenue in 2022 reached $0.95 billion, projected to reach $1.42 billion also by 2027.
In the UAE, digital ad spend in 2022 can be summarised like so:
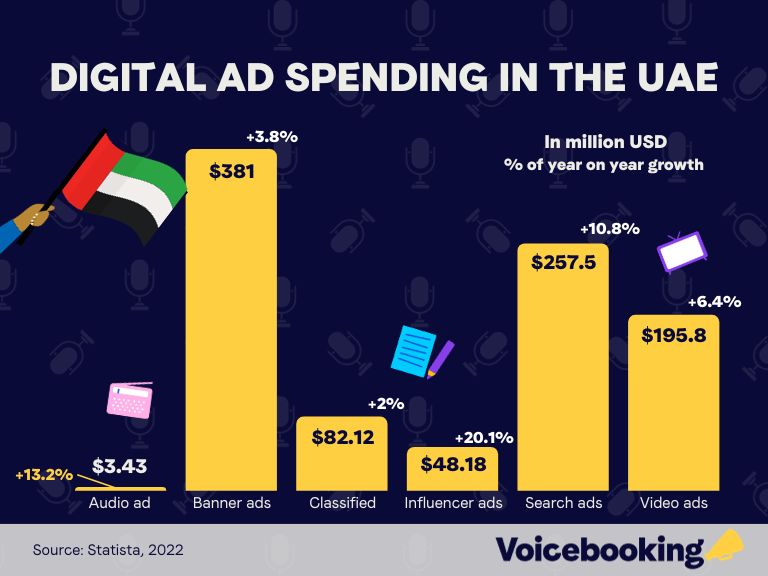
Share of ad spending was 54.4% for desktop and 45.6% for mobile; projected to reach 54.2% and 45.8% for desktop and mobile, respectively.
Social media ad spending reached $303 million in 2022, projected to reach $417.2 million by the year of 2027.
Overall digital ad revenue reached $0.97 billion in 2022, projected to reach $1.37 billion by 2027.
In the USA, total ad spend is projected to reach 306.9 billion in 2023, up from 2022’s $287.13 billion (or an increase of +6.9%).
In 2022, 73% of ad spend in the US was made up of digital ads, and 23% traditional mediums; By 2027, digital advertising is projected to reach 83.3%, whilst traditional ads are set to reach 16.7%.
Split up by medium, the overall ad spend for the USA can be summarised like so, with budgets allocated accordingly:
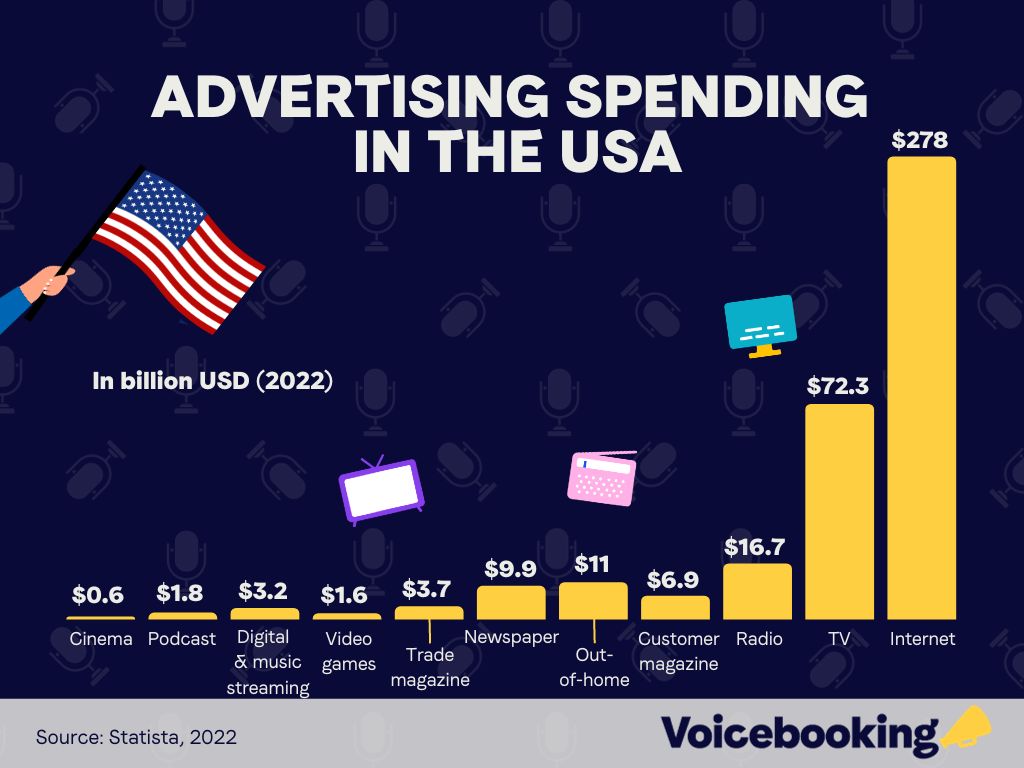
The USA is projected to spend $56.85 billion in social media ads by the end of 2023, up from $48.94 billion in 2022 (+16.2%).
Total spend for TV ads is projected to reach $66.31 billion by the end of 2023.
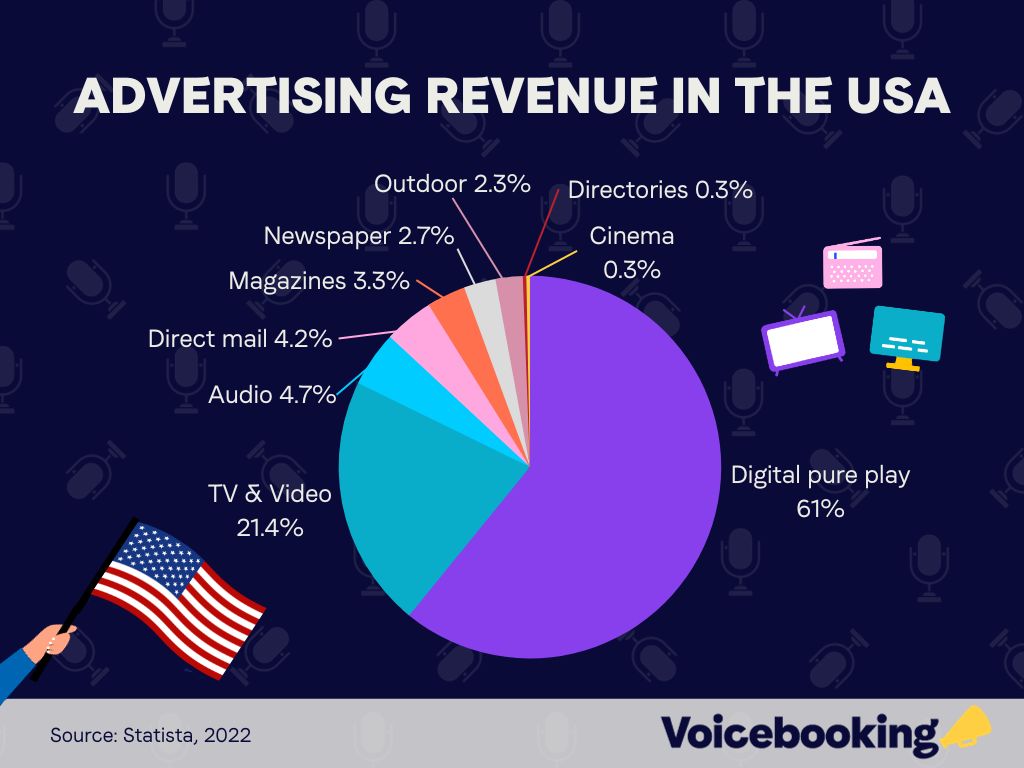
Online advertising revenue reached $209.7 billion in 2022.
Broken down by medium, the overall share of ad revenue can be summarised as follows:
Canada ad sales surpassed $20.4 billion in 2022, and is forecasted to grow to $21.3 billion (+4.3% growth) by the end of 2023.
By format, overall ad spend for Canada in 2021 can be summarised by percentage, as follows:
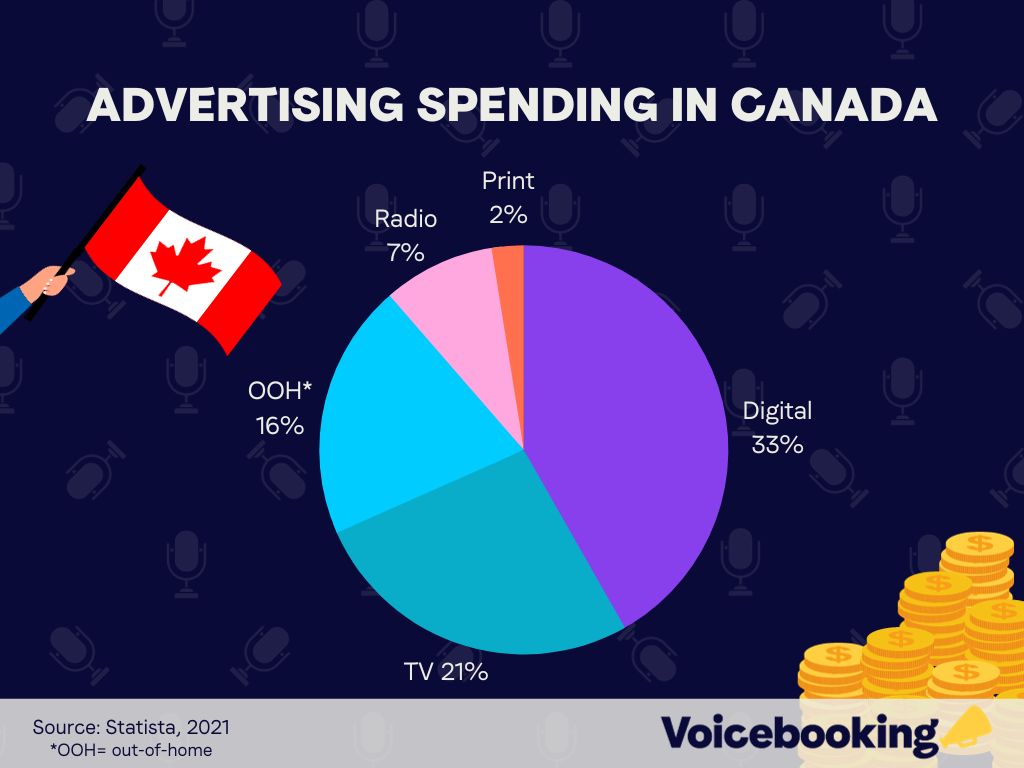
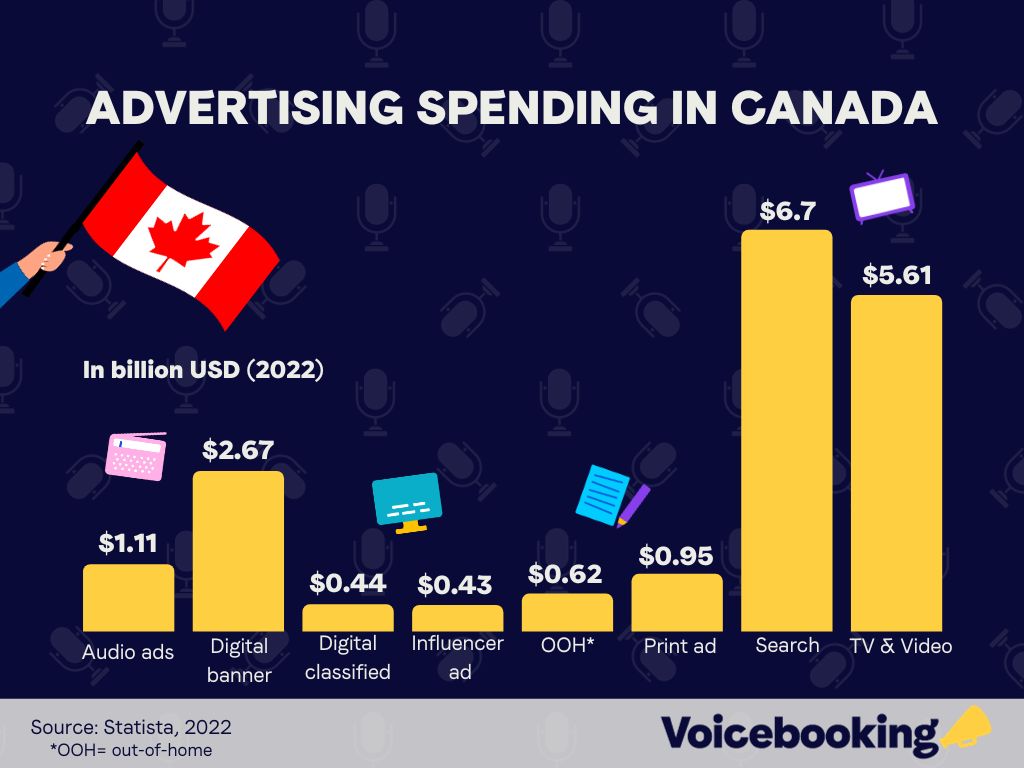
In 2022, Canada spent over $14.66 billion on digital marketing, with a 14% rise from the previous year allocated towards social media.
Cinema ad spend reached $694 million in 2022, projected to reach $763 billion by the end of 2023.
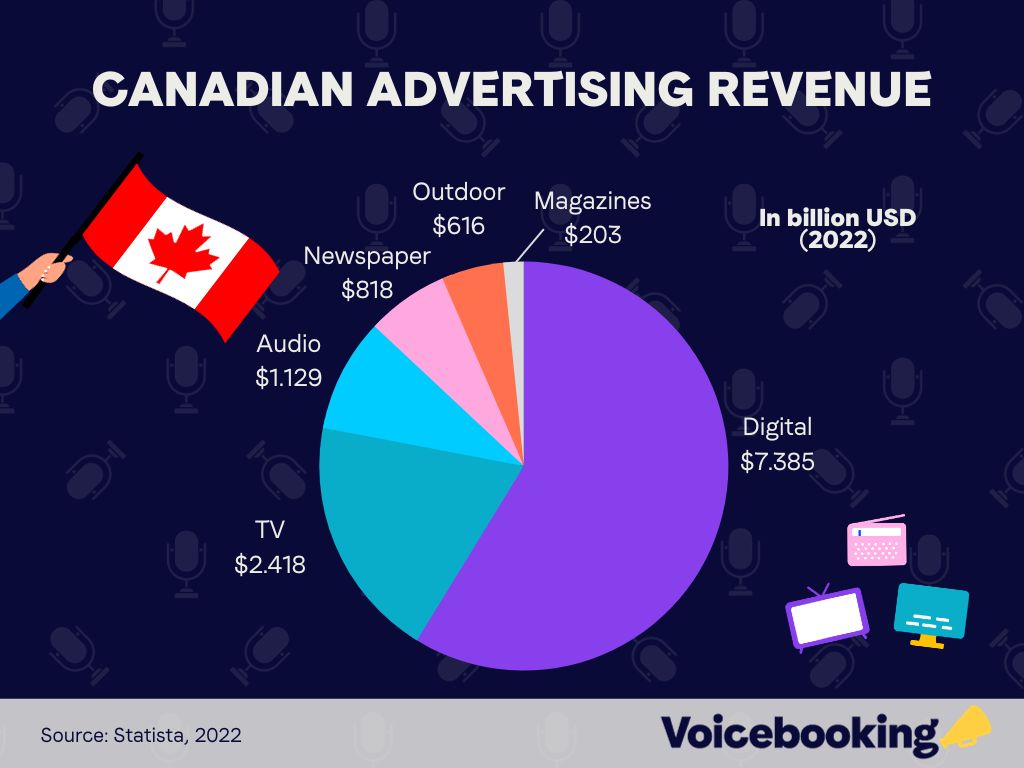
Canadian TV ad revenue reached $2.81 billion in 2021, up by 12% compared to the previous year.
Radio ad revenue reached $1.06 billion in 2021, down by -5% year on year.
Digital ad revenue is projected to reach $7385.4 million by 2023.
In 2022, Latin America spent a total of $21.2 billion, up 9.8% from the previous year’s $19.3 billion.
Broken down by medium, total ad spend in 2022 for Latin America can be broken down like so:
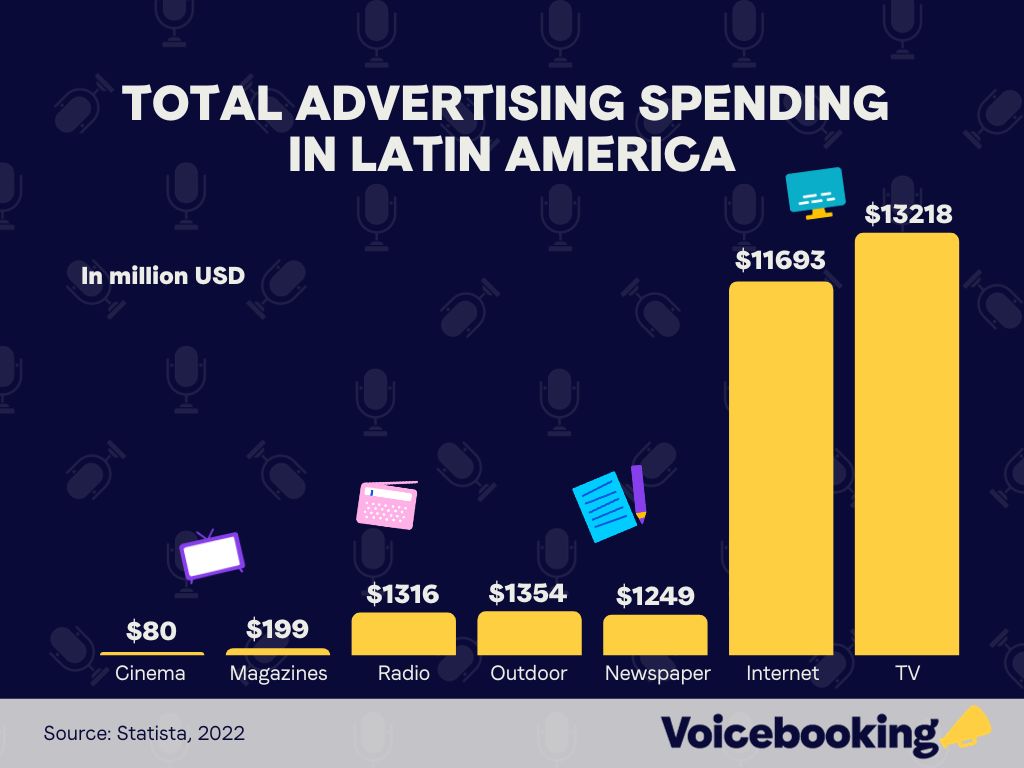
Of the list, the biggest expenditures fell between TV and internet advertising budgets in the year of 2022. Magazine and newspaper were among the lowest spend, projected to drop even further by 2024, following the progression of digitisation.
Radio ad spend is projected to continue growing, by as much as 7.6% by the end of 2023, projected to slow to a 3.4% growth by 2024.
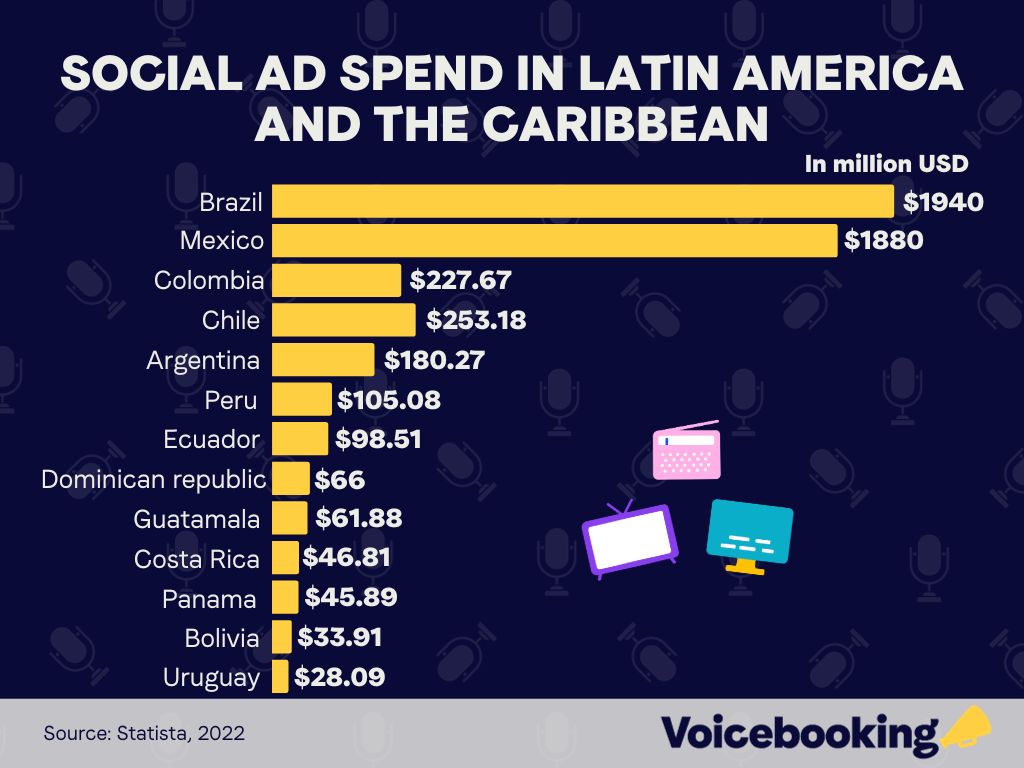
Social ad spend in Latin America and the Caribbean reached $5.29 billion in 2022. Below is a break-down by country:
Total ad spending is projected to reach $317.6 billion by the end of 2023.
The largest segment within this category is TV & video advertising, with a market volume of $103.5 billion.
Advertising spend (in 2021) broken down by medium, shows the following numbers:
Social ad spend in 2022 for desktop & mobile totalled $13.89 billion, and $67.81 billion, respectively, projected to grow to $15.94 (+14.7%) and $89.29 billion (+31.7%) by 2026.
Ad spend allocated to TV-related mediums reached $53.35 billion in 2022, projected to reach $51.98 billion by 2024 (a decrease of -2.56%).
Radio ad spend reached $5.53 billion in 2022, projected to reach $5.27 billion by 2024 (decreasing by -4.7%).
Digital audio advertising spend is projected to reach $2.23 billion by the end of 2023.
In 2022, the advertising economy in the APAC region grew by +8%, projected to expand further by +7% by the end of 2023.
Sources:
Statista
Informa
Reportlinker
Zenithmedia
Media in Canada
Campaign brief Asia
PWC
Murf AI
Market effect
N Logic